Friday, October 2, 2015

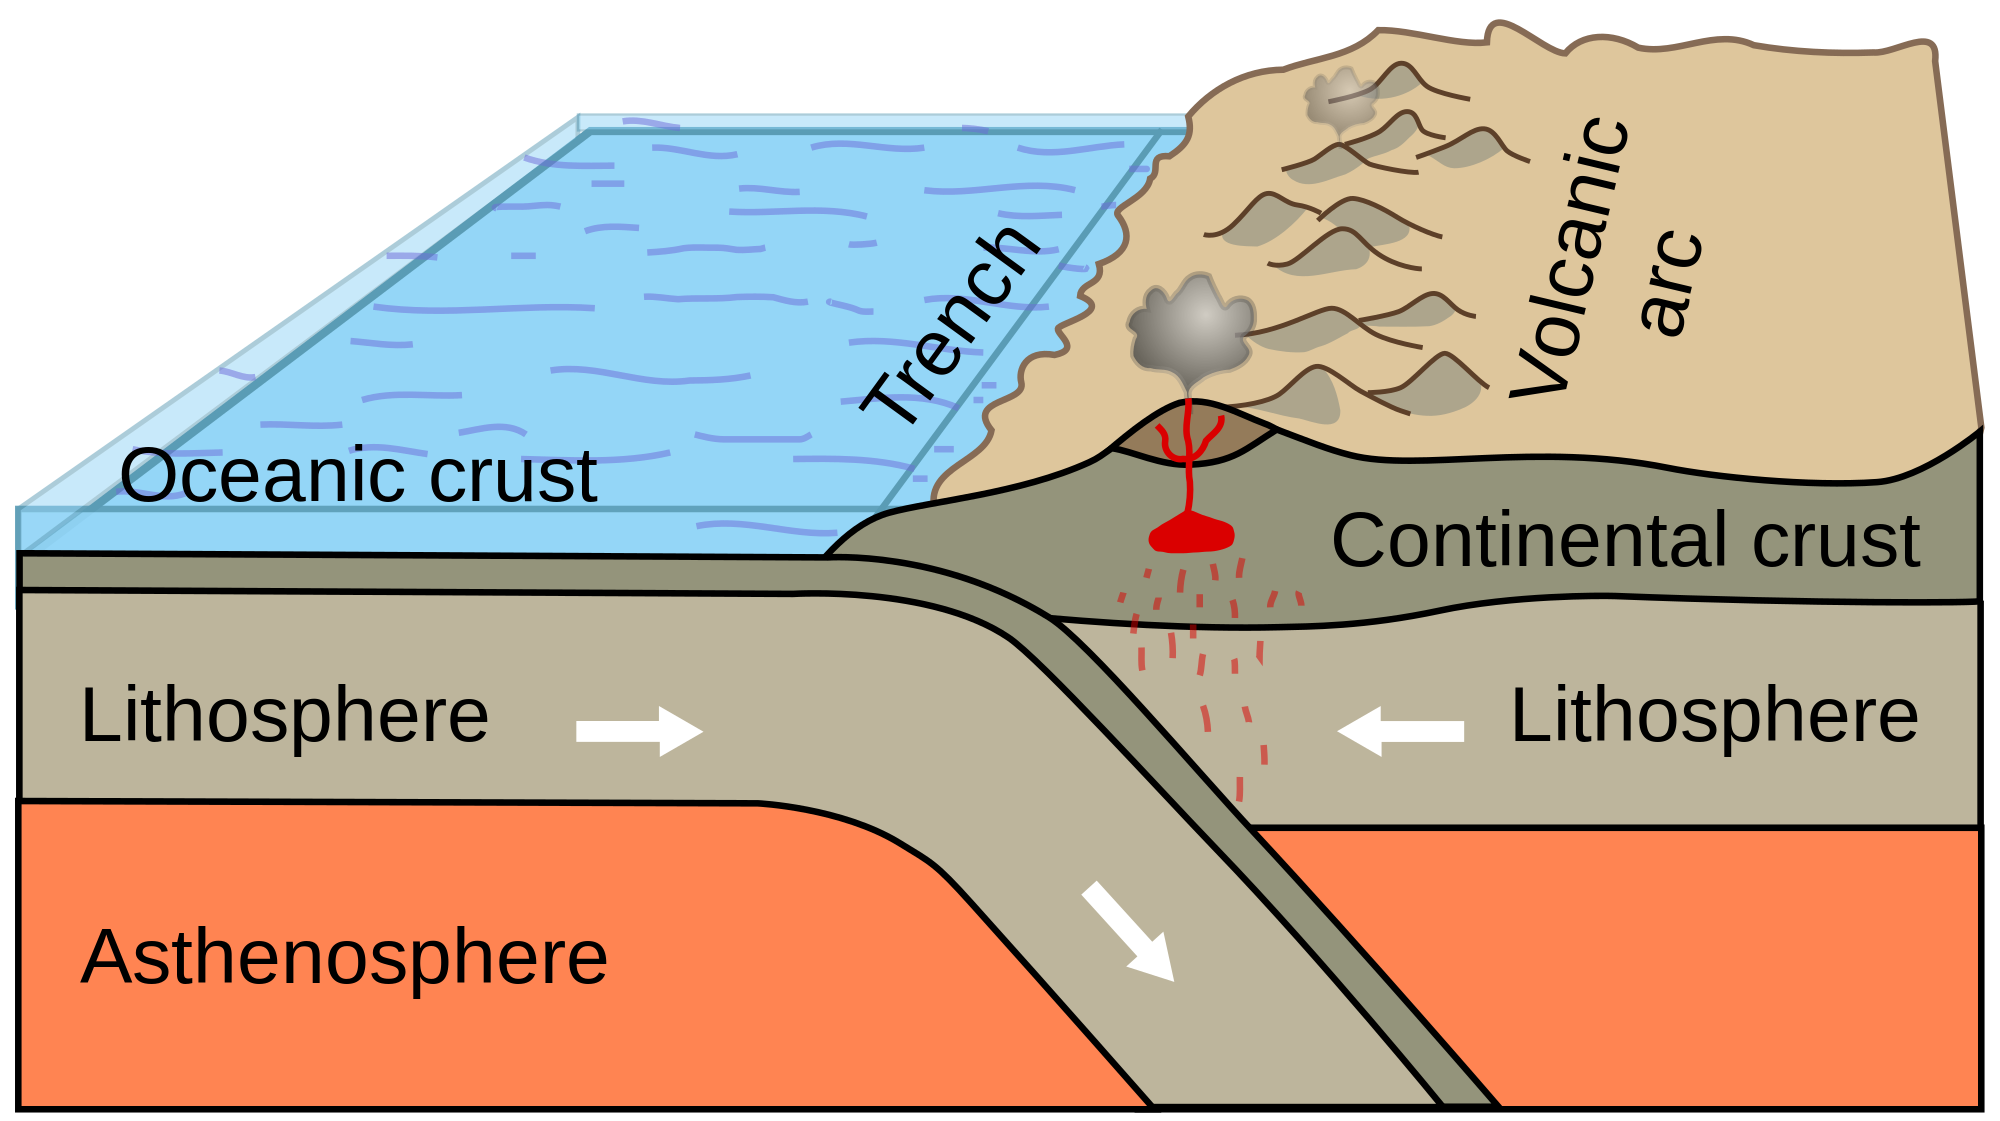
Plate Tectonics - The Crust - Weekly Blog 09/28 - 10/04

Image Source: https://goo.gl/pxvH0o

Summary: 

Viscosity is the amount of thickness in a liquid. If you put a marble a bottle of oil, you can see that it sinks slowly to the bottom of the bottle. This is because that oil has a lot of viscosity. If you put something in a liquid with a lot of viscosity, it usually is slow in sinking. If you put a marble in a bottle of water, you can see that the marble sinks towards the bottom of the bottle faster than the one in the bottle of oil. This is because water has no viscosity. Viscosity also affects the shape of a volcano. Have you heard of shield volcanoes? They kind of look like this: 
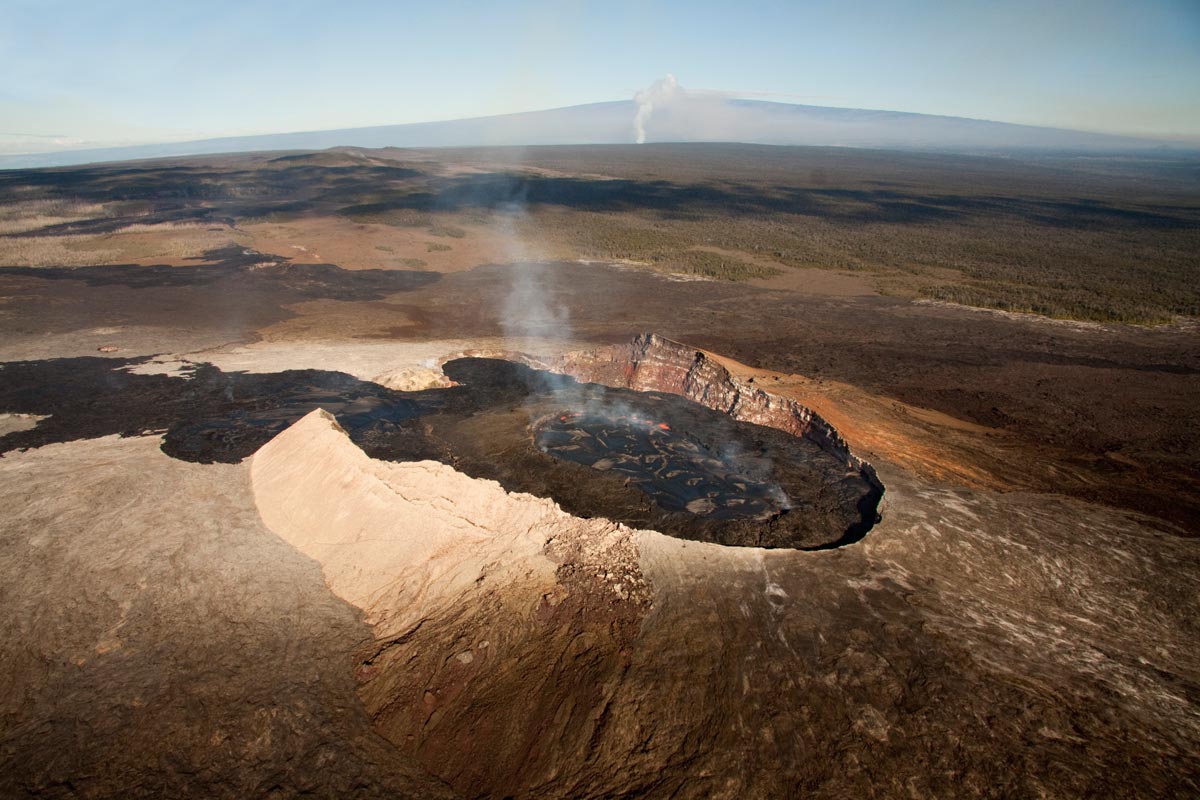
Image Source https://goo.gl/v6Ak0H
More of a flat volcano and not
really a pointy volcano. This is because 
of viscosity. If the magma has low silica and high temperatures, it should be runny lava, which has little viscosity, which forms a shield volcano.

SP2: Developing and Using Models:

    This week, I continued to build my volcano, and make it erupt. Me and my table had 3 bottles of sugar and 3 magma cups. We uncapped one bottle of sugar and put it in the volcano hole. Next, we put a cup of magma into the sugar, and then we stirred it with a popsicle stick. We saw that magma batch #1 was the fastest magma batch to flow down the volcano, meaning that it had little viscosity, and magma batch #2 was the slowest magma batch to run across the magma, which meant that it had a lot of viscosity.

    Another model that I did was the Snack Plate Tectonics Activity. This activity simulated plate-interaction activity. First part I did was putting a thick amount of frosting on wax paper. The frost represented the asthenosphere Then, I put two squares of fruit roll-ups that represented the oceanic plates right next to each other on the frosting. Next, I spread them apart slowly, and slightly pushing them down on the frosting. In between the fruit roll-ups, some of the frosting was exposed and rising. I think this formed a volcano at the process. Another part I did was put a fruit-rollup square and a graham cracker which represented the continental plate right next each other. Then I made them overlap. This was a subduction. Next, I dipped two edges of two graham crackers and I faced the wet edges toward each other on the frosting. I pushed them together, and the crackers started forming a mountain. At the end of this activity, I got to eat all of the remaining snacks used in this activity

Saturday, September 26, 2015

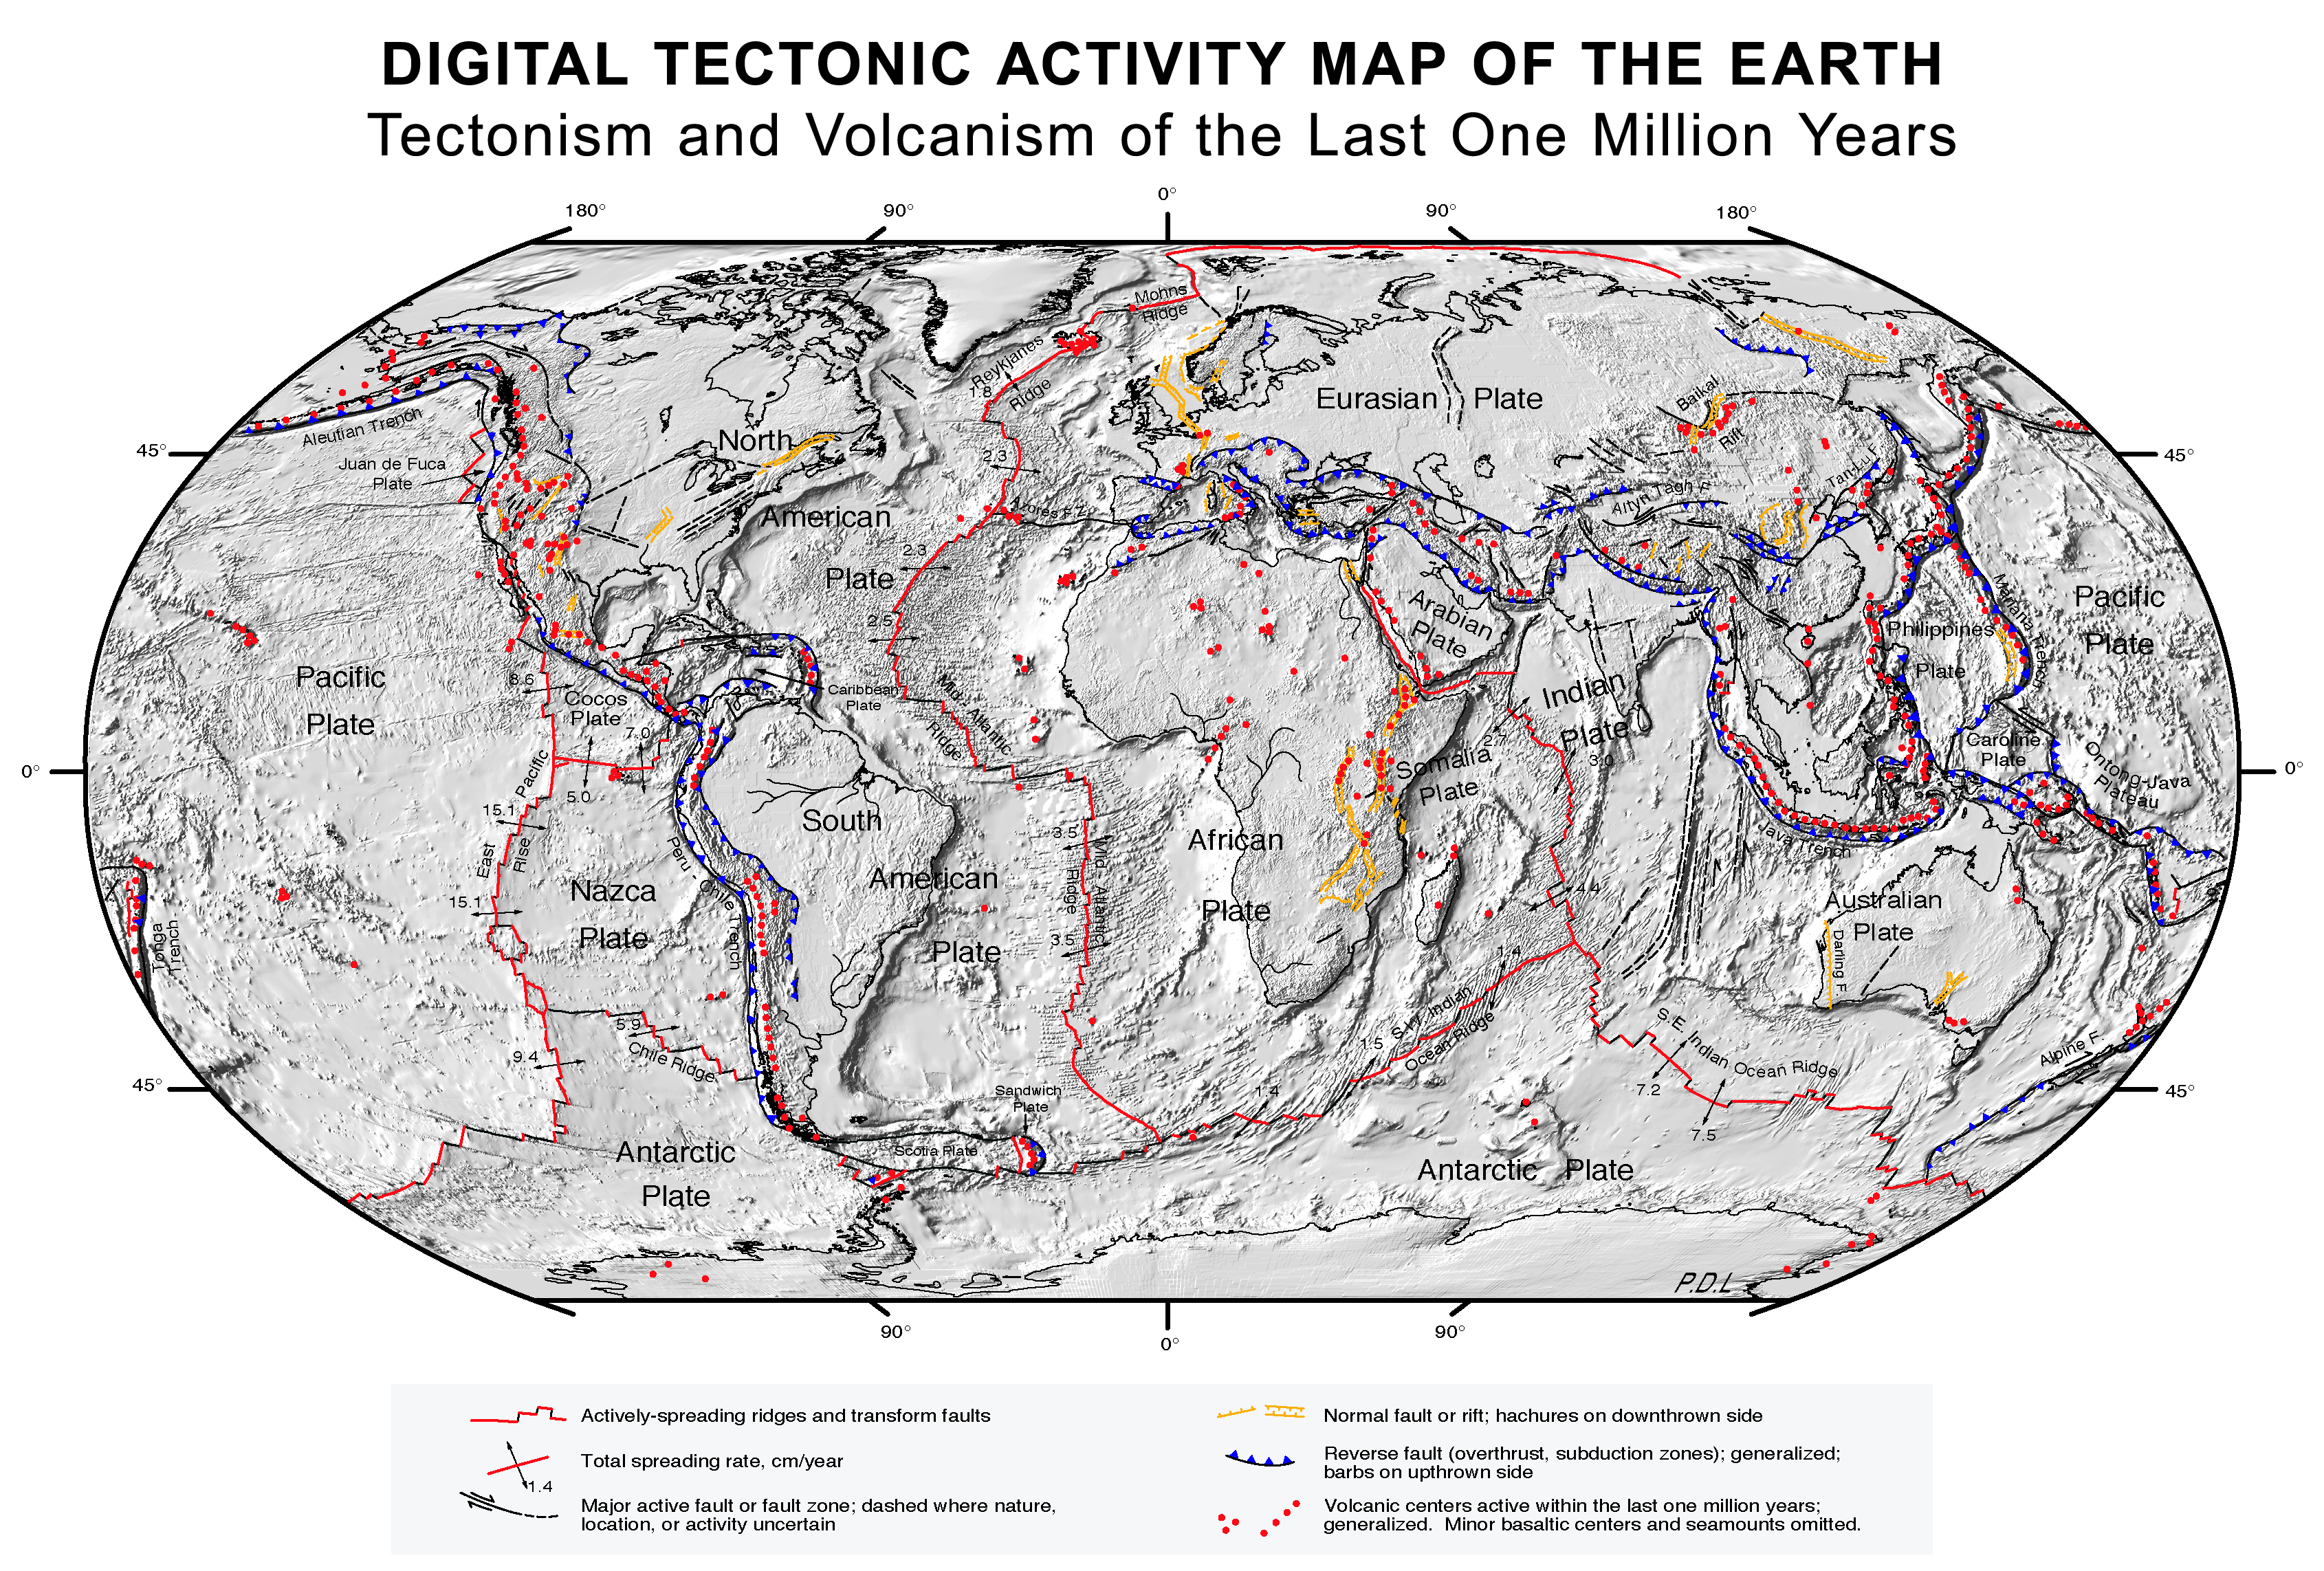
Plate Tectonics - Weekly Blog 09/21 - 09/27

Image: https://upload.wikimedia.org/wikipedia/commons/b/b4/Plate_tectonics_map.gif

Summary:

Alfred Wegener found that Africa and South America have some of the same fossils and plants. He wondered why. When he was making a map, he noticed that South America and Africa kind of fit like a puzzle. This event led him to discover a huge and massive land: Pangea. Pangea meant "all the land". Pangea was the massive land that eventually split up into seven continents. When Wegener shared his work, no one believed him, so his research went to the trash. 20 years after Wegener died, a man named Hesse discovered that the sea floor spreads and the continents move. When he shared this idea, people believed him and found out that Wegener had the same discovery. Hesse had discovered a part of the earth: Plate Tectonics. Plates are different pieces of the crust or lithosphere. It can spread apart, hit each other, and slip past each other. Plates push together, and when they slip, it causes an earthquake. This is called a strike-slip fault.

SP2: Develop and using models

I constructed physical, mental or conceptual models to represent and understand phenomena when I did an activity that showed the earth's layer's development and how long does one thing take to completely develop (actually, parts of the earth are never completely developed). Another activity done this week was how earth quakes work. Me and my table had two wooden bricks with layered clay stacked on top each other on top of the wooden bricks. Below the wooden bricks, there was a magnet so the wooden bricks wouldn't separate far. Then, we placed toothpicks across the clay. The toothpicks resembled a fence. When we moved the two bricks, I saw that the fence kind of moved past each other as if someone had moved them.


Saturday, September 19, 2015

The Rock Cycle - Weekly Blog 9/14 - 9/20


Summary: 

The three types of rock are sedimentary, metamorphic, and igneous. Any of the three rocks can turn into each other. Sedimentary forms when rocks are broken down into sediments and then squeezed together. It takes a long time to get this process done. Metamorphic rocks form when rocks are squeezed by pressure and heat. Igneous rocks form when they are in magma and are cooled. The rocks are usually in volcanoes and when they erupt, the rock is exposed to air, and is cooled, thus turning into an igneous rock. In the rock cycle, heat, pressure, magma, air, wind and erosion help these rocks form into sedimentary, metamorphic, and igneous.

SP8: Obtain, evaluate, and communicate information:

This week, I completed the Rock Cycle Cartoon. I gathered all my data by rolling die and going to the location it tells me to. For example, I started on the soil table, I rolled the die, it told me that pressure occurred and that I had to go to the Earth's interior table. Then, I wrote down each event and where I went to in order. I evaluated my data by reviewing the data I had just obtained. Then, I communicated my information by drawing it on a cartoon, which showed what event happened, and where I went to next. 

Friday, September 11, 2015

Scientific Method Cartoon - Weekly Blog 09/08 - 09/11


Summary: 

This week I made a Scientific Method Cartoon. This followed the new scientific method. I made a draft of my cartoon, and once it got approved, I could move on to my final draft of my cartoon, which is the image above.

Backward Looking:

I have done a similar project like this before last year, in 5th Grade. It was like this one, but it was a cartoon about the water cycle. It had more steps to it and had a different character, which was a rat in drop. That project is similar to the Scientific Method Cartoon and I kind of remember the water cycle cartoon ever since we did this project.

Inward Looking:

If I were to compare this project with something, I would compare it with the Water Cycle Cartoon. I would compare both of them because they are similar. The Scientific Method Cartoon has more slides and has better drawings compared to the Water Cycle Cartoon, which was still good, but was a bit worse in drawings than than the Scientific Method Cartoon, and had less steps which isn't really bad. The only changes I could see are the drawings, since I could see that they have improved.

Outward Looking:

In this project, I would give myself an A. I would give myself an A mainly because I am satisfied about what I made during this project. But also, I think that I did a good job with the drawings and text. Not just those, but also the dialogue. It's not the best drawing, but its good.

Forward Looking:

One thing i'd like to improve upon is my drawing and dialogue. Yes, I know I said they were good to me, but I would just like to improve on it. Also, I would want to make my text more readable because they were not easy to read.

Friday, September 4, 2015

Paper Airplane Experiment - Weekly Blog 08/31-09/06


Summary:

Different kinds of paper made into paper airplanes fly different distances. It depends on their weight, air-resistance, how people throw it, wind, weather, etc. If you don't have a fair test (for example, flying each paper airplane each with a certain force), you won't get accurate results. Once you are done with your experiment, immediately write down your results. After you are done gathering your results, analyze it, see if it matches your hypothesis. If it doesn't, then change your hypothesis and you experiment again. If your results do match your hypothesis share it, or else there is no point in actually making the scientific investigation at all. 

SP8: Obtain, evaluate and communicate information:

My team and I completed a paper airplane experiment which tested which type of paper flew the farthest as a paper airplane. We obtained the information by making experiments and measuring how far the paper airplanes went. We evaluated our data by discussing the results that we got during the experiment. We also Communicated our information by putting our Question, then a Hypothesis, to 
our Results and Conclusion on a poster. When we were putting our data on a poster, we discussed how we should put them in order. 


Friday, August 28, 2015

Scientific Method 08/24 - 08/28

Image source: https://encrypted-tbn3.gstatic.com/images?q=tbn:ANd9GcToR5ENzMjfVnQH7M92dnAuAqRo7Aj-ckTVle-lj3c-7sc0PUJU

Summary: 


The scientific method always starts with a question or problem based on an observation. There are many different orders in which it could be. The summary of the steps are the Observation, Define Question, Research, Experiment, Gather data, make conclusions, and then share your work. There are also a new and old scientific method, but we talked about the new scientific method this week. The NSTA said that "There is no fixed sequence of steps that all scientific investigations should follow". I think this means that there is no real way that you should make a scientific investigation. You make your own, but you can follow other paths.

SP8: Obtain, evaluate and communicate information:

I completed The "NEW" Scientific Method sheet and thought about the order of the steps with my partner that I worked with. We talked about the steps and how they should fit in order. I also completed the Scientific Method Refresher. I obtained information by clicking on provided links and gathering my data there. I evaluated my work by often talking to the person sitting next to me and often talked about some of the questions. I communicated my information by sometimes sharing my ideas with my table mates.


Wednesday, August 19, 2015

Goals for 2015-2016

My goals for 2015-2016:

 -Improve on my Math grades and work (compared to last year).
- Learn how to make better art in art class.
- Learn new cool techniques and facts in all subjects
- Learn a lot more than last year in all subjects
- Type faster than last year
- Improve my grades from last year
- Achieve the highest rank (aka Arch Mage) on science

If all of this happens, I'll celebrate with cake.