Sunday, December 17, 2017

Charity Fair (Project Blog 12/11 - 12/15)


Summary:

     The Clean Clothes Campaign in the largest global charity dedicated to stopping sweatshops in the garment and sportswear industry. They improve working conditions in sweatshops by pressuring both the manufacturer and retailer to raise worker wages rather than boycotting them and potentially leaving hundreds of workers unemployed. In addition to that, they support struggling workers in sweatshops by creating networks with them alongside Labor Unions and Non Governmental Organizations. A couple of events that demonstrate the Clean Clothes Campaign's their participation in the aftermath of the Rana Plaza Collapse and the burning of an H&M sweatshop, both of which happened in 2013. During both of these events, the CCC supported the victims of these two events and constantly pressured the owners of the sweatshops to improve working conditions. Looking at this charity and what is has done so far, my partner and I decided to choose this charity since it solves what we feel strongly about and works effectively to stop the issue at hand.

Backwards Looking: 

     What process did you go through to produce this piece? To produce a tri-fold that both advertises me and my partner's charity and product, we first had to research what the Clean Clothes Campaign was, what it did and how it did it, which is explained in the summary. The next step was to figure out what we were going to make that relates to our charity. We decided to make Kanzashi Christmas trees in order to support the Clean Clothes Campaign. What followed next was another series of research in where we were trying to find the cost and profit of making our item and how much our charity made in a year and how it distributed the money. Delving more into our product, we made a step-by-step tutorial in order to show the process of how a Kanzashi Christmas Tree was made. The final step was to compress all that information into a tri-fold. 


Inwards Looking:

How do you feel about this piece of work? What parts of it do you particularly like? Dislike? Why? What did/do you enjoy about this piece or work? I felt that this year's charity fair could have been far more better than it was. However, it isn't due to any of the components assigned by teachers that made this charity fair unsatisfactory. The part that made this year unsatisfactory was the product. My partner and I planned to make 5 Kanzashi Christmas Trees each so that we would make a total of 10 which was the minimum requirement for quantity of items. However, during the night of the charity fair, I brought the 5 that I was supposed to make while my partner only brought in one Kanzashi Christmas tree which made me feel a bit disappointed due to the fact that we could have done more to support our charity. Despite that, I feel like all of the other components that we worked on far surpassed my expectations and of what I did in my previous years due to how insightful all the information was on what the charity was and our product.


Outwards Looking:

In what ways did your work meet the standards for this assignment? In what ways did it not meet those standards? I believe our work in this year's charity met most of the standards for this assignment. As I have stated before, our main resource was our charity's website which provided many information about themselves and was proven to be a main asset in this project. The charity research, statistics and presentations all elaborated on the Clean Clothes Campaign as a whole and even goes into depth on why sweatshops exist in the first place and how this charity is effectively improving worker wages. I think that the product that we made this year was also met the standards in regards to quality, as it took a long time to make and had a pleasant appearance once it was done in the making. I think that my partner and I's final product met all of the standards except for the quantity of products, since we made only a total of 6 out of 10.

Forward Looking:

As you look at this piece, what's one thing that you would like to try to improve upon? Looking back at how I did overall, I feel like I could have managed my time more wisely. I feel like the week making the instructables was a waste. It only took one and a half class periods to finish it, yet I spent most of the rest of the week doing nothing due to the fact that I didn't have the printouts for the project yet. I also felt like the product that I made could have been better as well, although this may be slightly nitpicky. I did five of the Kanzashi Christmas tree over the break but two of them had some gaps in between the leaves. I could have filled them in but I spent the break doing other things and I ended up fixing them before the day of Charity Fair. Overall, I think the weakest point in this project was my management with time.

Friday, December 8, 2017

Distance and Displacement (12/4 - 12/8)

Image Source: https://goo.gl/FRDNWA

Summary:

     In physics, two out of the many important measurements are distance and displacement. These two factors measure how far an object moved from its starting point to its end point. Distance is a scalar quantity, which measures magnitude. It measures the original path that an object took in its time of motion. Displacement is a vector quantity which measures both the magnitude and direction. Displacement measures how far out an object is from its original starting point. In other words, displacement is the shortest possible distance from point A to point B. 

SP3 - Launching Investigations:

     This week I began in investigation when studying distance and displacement. With my partner, we were to investigate if and how displacement and distance affect each other. To do this, we found a specific location to test our hypothesis on, which was that the distance affects displacement of an object by increasing it. Our first step was to place down a piece of tape on the location we decided on. Next, we were to follow the directions on taking steps. The final step was to measure and record both the displacement and distance of our travel. We did these three steps three times and noticed that the displacement was always greater than the displacement unless the path is a straight line because displacement shows the shortest possible route from the starting point and end point. 

Sunday, December 3, 2017

Carbon Footprint (11/27 - 12/1)

Image Source: https://goo.gl/TnEmkJ

Summary:

     Carbon footprint is the total amount of greenhouse gases emitted into the atmosphere after an event, activity or movement. All the emissions sent into the atmosphere is combined and calculated as an equivalent to a quantity of Carbon Dioxide, given the name carbon footprint. It is important to plan out an event keeping carbon footprint in mind and tracking how much has been emitted from that activity since if kept neglected, more emissions would be sent into the atmosphere which would take a toll on the environment. Carbon footprint is usually tracked when importing and exporting products and goods because the modes of transportation most commonly use gas which emits greenhouse gases into the atmosphere.

SP8 - Obtain, Evaluate, Communicate:

     This week my partner and I calculated and displayed the carbon footprint produced when making our product, the Kanzashi Christmas Tree. The first step was to obtain the basic data in order to find out how much carbon footprint was used to make one. To do that, we had to find out the distance between the retailer and the manufacturer. We had to multiply the distance in miles by 0.8g if the product was sent via plane, 0.17g if sent via truck, 0.1g if sent via train and by 0.41g if sent via car. Our products were either sent overseas or by the same state from manufacturer to retailer and the last part of the carbon footprint was calculating the distance between the retailer to AdVENTURE STEM. Calculating all of this, we had a total of 22045.206g of CO2 used to make our products.

Saturday, November 11, 2017

Biological Classification (10/6 - 10/9)

Image Source: https://goo.gl/dxAVVq

Summary: 

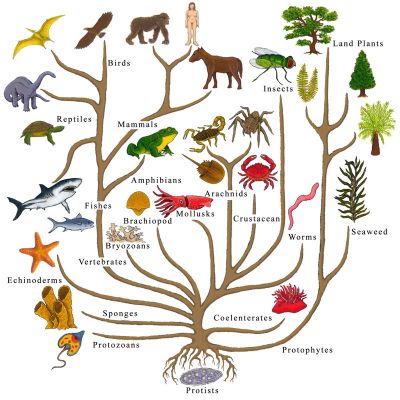
     Earth is full of life. The life on earth come in different categories, known as species, which is a group of organisms that share very similar traits and appearances to each other. Today, there are approximately 8.7 million species living on earth, according to the New York Times. That is a lot of species to account for. Because of this, there has been a way to classify these organisms. It is known as biological classification, first done by Linnaeus. Biologists classify organisms in a diagram known as a cladogram to show which species have similar traits and which ones do not. The higher the cladogram goes, the less traits species have in common. 

SP6 - Constructing Explanations: 

     This week I constructed explanations through my work in understanding biological classification. In order to understand it, I looked at how species had diversified over the years through the cladogram. All organisms began with DNA. Eventually, some organisms began to have complex cells with organelles inside of them. These organisms were known as eukaryotes while the organisms that didn't have complex cells were either prokaryotic or archae, single cell organisms. Eventually, animals had vertebrae then evolving into tetrapods while some didn't like the shark which only remained having a vertebrae. Soon, some animals begun being bilateral and symmetrical, while some begun to have diapsids. Through the worksheet and the website I was supposed to investigate, I explained how animals diversified through the years. 

Thursday, November 2, 2017

Tree of Life (10/30 - 11/3)

Image Source: https://goo.gl/6iKSjS

Summary: 

     All organisms that are alive and currently extinct all have a common ancestor. Although we don't know who or what the specific species is, there is sufficient evidence to make that claim. The first form of evidence is comparing fossils and bones together to see which ones are similar. Humans, bats, cats, lizards, whales and birds have a humerus, radius, ulna, carpals, metacarpals and phalanges. Although these parts vary depending on the species, this proves that species once had a common ancestor that eventually diversified through the process of evolution. Another form of evidence is by comparing the traits between species. Using a cladogram, we can tell where a species split into two sections. Looking at a caiman, bird and T-Rex from a cladogram, it shows that they all have common traits such as having vertebrae, a bony skeleton and four limbs which proves that they have a common ancestor. 

SP4 - Analyzing and Interpreting Data: 

     This week I analyzed and Interpreted data when trying to investigate how all organisms have a common ancestor. The first piece of evidence that I analyzed were homologous structures. Many species (mammals in particular) have the same forearm skeletal structure, having a humerus, radius, ulna, carpals, metacarpals and phalanges. This proves that there ha been a common ancestor and has diversified and evolved into these organisms. The second piece of evidence is embryology images of animals in their embryo state. From the images alone, we can see that many of the organism's in their embryonic state are similar, which shows once again that organisms once had a common ancestor.  

Saturday, October 28, 2017

The Peppered Moth (10/23 - 10/27)

Image Source: https://goo.gl/HVMaUY

Summary: 

               The peppered moth is a great example of survival of the fittest at its finest. The time where natural selection is demonstrated with these species of moths dates back to the pre to post Industrial revolution. During the pre-industrial revolution, there were two types of peppered moths, white peppered moths and dark peppered moths. However, due to the fact that the trees that they inhabited were white, the white moths were able to blend from predators which meant that they were able to survive long enough to mate and pass on the white body trait to future generations. However, during the Industrial revolutions, coal emissions became much more common, making the once white trees now dark. This allowed the dark moths that used to be less prevalent than the white moths blend in with the environment more and hide more effectively from predators. This change made white moths less prevalent while making dark moths more prevalent. By the end of the Industrial Revolution, the rate of coal consumed died down making the trees turn back to white and making the white moth population recover.


SP4 - Analyzing and Interpreting Data:

               This week I graphed out the populations of both white and dark moths in the span of 10 years twice. Each data set was a representation of a time before, during, or after the Industrial Revolution. The first data set showed the population of dark and light moths in the span of 10 years during the pre and mid Industrial Revolution. While graphing the data, I noticed that the once prevalent white moths slowly declined in population while the black moths thrived and increased in population. From this, I inferred that this must've taken place before to during the Industrial Revolution since this was before any of the pollution started. The second set of data showed a clear contrast to the first one. I saw that the thriving dark moth population slowly started to decrease just as the white moths did and the white moths slowly recovering. Since the dark moths were once thriving in the first data set, I concluded that this takes place during and after the Industrial Revolution since the population of dark moths was initially at its peak at that time and decreased over time, which alludes to when coal emissions decreased and the trees became whiter which gave the white moths opportunity to recover in population. 
               

Friday, October 20, 2017

Natural Selection (10/16 - 10/20)

https://goo.gl/PdhSo1

Summary: 

          Natural selection is the process of elimination for traits in nature. Any negative trait for a species is discarded due to the fact that the species with that specific trait cannot maintain a long enough life to reproduce and allow their offspring to evolve. The traits that allow animals to thrive in their environment are kept and the animals with that trait continue to evolve. For example, there are a species of frogs. Due to mutation, the species is split into two traits; type A which has poisonous skin, and type B which has non-poisonous skin. Both types have a common predator. However, since type A is poisonous to predators, the predators can no longer eat that type. This focuses all the predator's' attention towards type B, the non-poisonous animal. Type B eventually goes extinct due to simply not being able to live long enough to reproduce while type A is allowed to reproduce, evolve and progress.


SP3: Planning/Carrying out Investigations: 

          This week I investigated, along with my table, how natural selection works. The first part of investigation was to have three different variants of predators. Due to the fact that live predators are rather dangerous in a school environment, we substituted them with a spoon, fork and a knife and for prey, we substituted them for an assortment of beans and buttons. In our table, each table mate had a utensil and for 20 seconds, we were allowed to scoop as many beans and buttons as we could. At the end of each hunting period, we had to count how much beans and buttons we collected and anyone that had a utensil that collected less than 20 beans collected had their utensil eliminated. By the end of four rounds, only the spoons remained. This is mainly because spoons were fit to survive in that environment. Forks had gaps in between each blade and knives are too thin to scoop things up. This activity/investigation helped me understand how natural selection works by discarding the negative traits and keeping the positive ones.