Saturday, November 14, 2015

The SPIA Decision - Weekly Blog 11/9 - 11/15


Summary: 

In America, every state is prone to at least three or more natural disasters. The area in the US mostly prone to Natural Disasters in in the East Coast. Everywhere beyond that is not really prone to Natural Disasters. North Dakota is the state that has three natural disasters. But those three natural disasters weren't that severe, and no state was similar to the information found about North Dakota on natural disasters. That is why North Dakota is one of the safest states in America.

SP8: Obtain, Evaluate, and Communicate Information:

This week, my team and I obtained information of  where the Safest Place In America (SPIA) is by looking at our maps that we made for our research and used it for our decision of the Safest Place in America. My team and I evaluated validity of our data by checking and looking at the maps and seeing which state had the least, prone to the least, or had the least prone natural disasters. We crossed out every state prone to four our more natural disasters, and found out that every state that we didn't cross out was prone to 3 natural disasters. But the state that was less prone to natural disasters was North Dakota, which had 3 natural disasters, but those three natural disasters it was prone to weren't very severe. We searched deeper into which city in North Dakota was safe, and we searched in the center of North Dakota. There, we found the city of Bismarck, and my team and I finally decided on the safest place in America: Bismarck, ND. I was the one who noticed that North Dakota was least prone to three natural disasters, and I communicated that information with my team and decided on the Safest City In America.

Saturday, November 7, 2015

Natural Disasters Research - Weekly Blog - 11/2 - 11/8

Image Source: https://goo.gl/YkRhdu

Summary:

A Natural Disaster is a disaster that is from nature. They can occur in the atmosphere (air), or on the ground. Storms in the U.S usually occur in places where warm, moist air and cold air meet. This is because that a lot of the storms in the U.S (Hurricanes, Tornadoes, Blizzards, etc.) form by warm, moist air, meeting cold air. The Western part of the U.S is not prone to these storms, since there are a lot of mountains there, which makes it difficult for the storms to form. The places prone to storms (East Coast to the Midwestern States) do not have mountains, which allows the storm to form. 

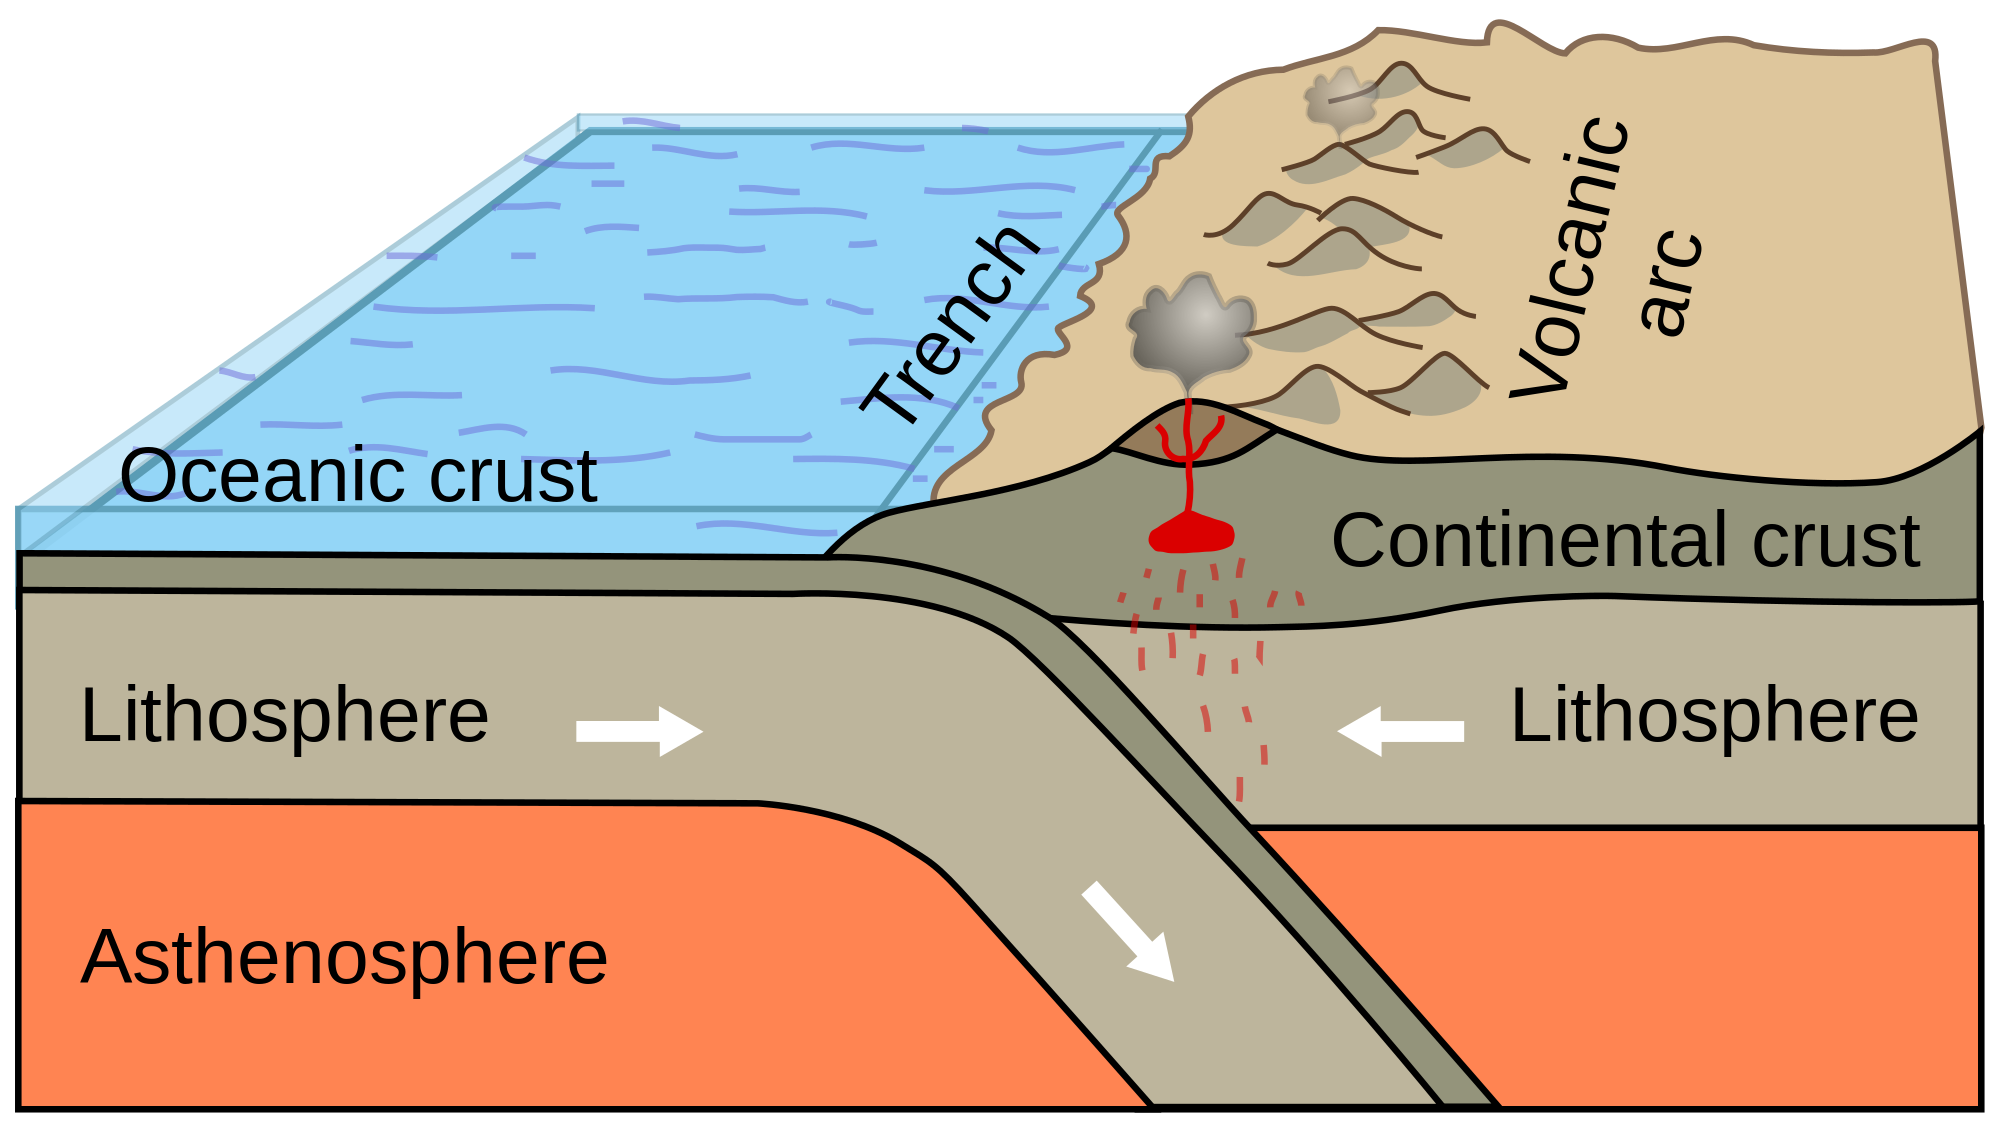
Other disasters, such as earthquakes and wildfires, usually occur in the West states of the U.S These states are prone to wildfires because there is a lot of vegetation which makes the wildfires easier to spread, hot climate, which provides heat to the wildfire and helps it grow, and human-environment interaction. These states are also prone to earthquakes, because the West has a lot of  faults, which is one source of the earthquakes, and the West Part of the North American Plate is pushing against the Pacific Plate, which can also create an earthquake if the two plates release.

SP8: Obtain, Evaluate and Communicate Information:

This week, I obtained data for my research by going on provided resources for natural disasters and going on the internet. I also obtained some data from using background knowledge I had from the Plate Tectonics Unit. I communicated obtained information by discussing the data of the research with my team and changing some of the answers as we were discussing our data. We evaluated the validity of our research by discussing it, checking the answers with the teacher, and going on a few sites (last updated 2013-2015) to see if they were all the same answer.

Sunday, November 1, 2015

Natural Disasters - Weekly Blog 10/26 - 11/01

Image Source: https://goo.gl/lJ8ZNK

Summary:

   Natural disasters are disasters that come from nature itself. These include: Tsunamis, wildfires, hurricanes, typhoons, tornadoes, floods, etc. These occur due to climate, climate changes, vegetation, environment, weather, landscape, and human-environment interaction. They can also happen because of things in the atmosphere/air, and from space. For example, tsunamis can form from a meteoroid hitting the ocean, These are the reasons why some states in America are prone to these natural disasters and some aren't. Some states have these conditions while others don't. 


SP8: Obtain, Evaluate, and Communicate Information:

   This week, I obtained data from my research on Natural Disasters for my Presentation on the Safest Place in America Project. My research included: Describing the Natural Disaster, Where they occurred geographically, and on what conditions does this natural disaster form and why they form. The last thing I put on my research is filling in and coloring which states are prone to these natural disasters. I evaluated the validity of my work by checking two sites that had the same information, and both were last updated just recently and getting my research sheets approved by the teacher which means that my research is valid. Then, I communicated my work by sharing my data that I found with my team, and discussing the information each of us found. 

Saturday, October 24, 2015

Plate Tectonics Project - Project Blog - 10/18 - 10/25


Summary:

          The Cascade Range, also known as the Cascade Volcanoes, or the Cascade Mountains, was formed over 35 million years ago due to the subduction of the Juan De Fuca Plate and the North American Plate. This subduction formed the 18 volcanoes of the Cascade Range. These 18 volcanoes are either Strato, Shield, Lava Dome, or Cinder Cone Volcanoes. The Cascade Range is currently a convergent boundary. The Cascade Range stretches as far as 700 miles length and has a width of 80 miles. It is located at the North American Plate, but more specifically, between Northern California and British Columbia in Canada. The Cascade Range is the part of the Ring Of Fire, which borders the pacific plate, and is home to a lot of volcanoes that are resting, extinct, or active. The highest point of the Cascade Range is the peak of Mount Rainier, at 14,000 feet above sea level.

Backward Looking:

     In what ways do you think you need to improve? There were a couple of things I think I could have worked on better. One thing was the planning, since during the project, a lot of things weren't planned, and me and my team completed the work out of the recommended schedule, so a few things were rushed. One last thing i'd like to improve is the presentation. I'd like to improve on this section of the project since it wasn't rehearsed, some of our statements and data didn't seem clear to the audience, and we put very little text to each slide, so it took a long time for the slides to transition.

Inward looking:

     How do you feel about this piece of work? What parts of it do you particularly like? Dislike? Why? What did/do you enjoy about this piece or work? Although there were many ups and downs to this project, I really did enjoy working on the project. My most favorite part of the project was making a model of the Cascade Range, since I really like making models. It also looked good, and was easy to make.. The part I really dislike was working on the presentation, since it was finished after the recommended schedule, and it was pretty hard gathering data. 


Outward Looking:

     If someone else were looking at the piece, what might they learn about who you are? If someone were to look at my project, they may learn that I work hard at projects, I take them really seriously, and I add a lot of quality to my projects. This applies mostly to my model, since I worked really, really hard at it, but some of it applies to the presentation slides that I made.


Forward Looking:

      As you look at this piece, what's one thing that you would like to try to improve upon? There are some things I would really like to improve on. One thing is the scheduling. During the project, I was behind the recommended schedule, so I had to basically multitask. Since I was behind the recommended schedule, the presentation was not as good as I planned it to be. One thing I planned was for the presentation to have a lot of information. One last thing I planned for the presentation was for the script and the presentation slide transitions to sync. What I mean by that is when I was done talking for that particular slide, it would move. But it wasn't that easy, so I really want to improve on that part.

Sunday, October 18, 2015

The Cascade Range - Weekly Blog 10/12 -10/18

Image Source: https://goo.gl/nr5vQq

Summary:

       The Cascade Range is also called the Cascade Mountains, or the Cascade Volcanoes. It starts at North California, stretches up North, and ends at British Columbia. It has a total of 18 Mountains. The Cascade Range was formed by subduction of the Pacific Plate (under the) and the North American Plate. It's highest peak (Mount Rainier) is at 14,409 feet above sea level. 


SP2: Develop and Using Models:

    I constructed a physical model to represent a few of the many mountains of the Cascade Range with my team. I made Mt. Rainier, Mt. St. Helens, Mt. Adams, Mt. Hood, and Glacier Peak, and added a compass rose. I first molded my mountains with aluminum foil, then I painted it, stuck it onto cardboard, labeled the mountains, and added finishing touches. I can see that I have improved on this practice based on the quality of my model, and how I improved on other things like the labels.

By Joshua Santos 2026-6B SCIENCE 

Saturday, October 10, 2015

Earth's Development & Mountains - Weekly Blog - 10/5 - 10/11

Image Source: https://goo.gl/nTezW5

Summary:

The Earth was created from debris from the sun. When Earth was created, nickel and rock formed the mantle. It is believed that we got our water on Earth from asteroids that had water in them. The Earth wasn't stable until it was 4.4 million years old. Speaking of Earth, Stratigraphy is the drawing of graphs from mountains and layers underground.

SP 2: Develop and Using Models: 

Me and my table used a drawing of the inside of Mount everest to understand what happened and is happening inside the mountain. We cut sections of papers (that looked like it had layers ad had a legend) that were numbered, put lined up together in order vertically, then taped them together. We looked at the now taped together papers, and saw that rocks from the oceanic crust were at the top of Mount Everest. This was because Mount Everest was underwater before emerging onto land. There were sea creature fossils at the top of mount everest to prove it. 


Friday, October 2, 2015

Plate Tectonics - The Crust - Weekly Blog 09/28 - 10/04

Image Source: https://goo.gl/pxvH0o

Summary: 

Viscosity is the amount of thickness in a liquid. If you put a marble a bottle of oil, you can see that it sinks slowly to the bottom of the bottle. This is because that oil has a lot of viscosity. If you put something in a liquid with a lot of viscosity, it usually is slow in sinking. If you put a marble in a bottle of water, you can see that the marble sinks towards the bottom of the bottle faster than the one in the bottle of oil. This is because water has no viscosity. Viscosity also affects the shape of a volcano. Have you heard of shield volcanoes? They kind of look like this: 

Image Source https://goo.gl/v6Ak0H
More of a flat volcano and not
really a pointy volcano. This is because 
of viscosity. If the magma has low silica and high temperatures, it should be runny lava, which has little viscosity, which forms a shield volcano.

SP2: Developing and Using Models:

    This week, I continued to build my volcano, and make it erupt. Me and my table had 3 bottles of sugar and 3 magma cups. We uncapped one bottle of sugar and put it in the volcano hole. Next, we put a cup of magma into the sugar, and then we stirred it with a popsicle stick. We saw that magma batch #1 was the fastest magma batch to flow down the volcano, meaning that it had little viscosity, and magma batch #2 was the slowest magma batch to run across the magma, which meant that it had a lot of viscosity.

    Another model that I did was the Snack Plate Tectonics Activity. This activity simulated plate-interaction activity. First part I did was putting a thick amount of frosting on wax paper. The frost represented the asthenosphere Then, I put two squares of fruit roll-ups that represented the oceanic plates right next to each other on the frosting. Next, I spread them apart slowly, and slightly pushing them down on the frosting. In between the fruit roll-ups, some of the frosting was exposed and rising. I think this formed a volcano at the process. Another part I did was put a fruit-rollup square and a graham cracker which represented the continental plate right next each other. Then I made them overlap. This was a subduction. Next, I dipped two edges of two graham crackers and I faced the wet edges toward each other on the frosting. I pushed them together, and the crackers started forming a mountain. At the end of this activity, I got to eat all of the remaining snacks used in this activity